 |
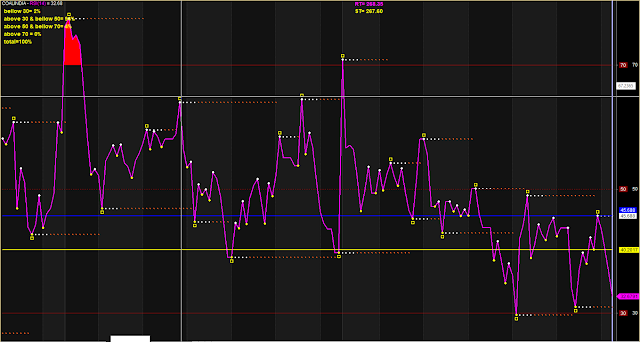
| Dynamic RSI With 50 Line |
//www.aflcode.com
_SECTION_BEGIN("RSI(14,30,70)MinMax");
SetChartOptions(0,0,chartGrid30|chartGrid50|chartGrid70);
periods = Param( "Periods", 14, 1, 200, 1 );
maxClip = Param( "maxClip", 70, 1, 100, 1 );
minClip = Param( "minClip", 30, 1, 100, 1 );
Plot( RSI(periods),"",colorCustom12,styleLine+styleThick);
r = RSI(periods);
PlotOHLC( r,r,50,r, "", IIf( r > 50, colorRed, colorBrightGreen), styleCloud |styleNoLabel | styleClipMinMax, minClip, maxClip );
_SECTION_END();
Plot( 30 , "", colorDarkRed);
Plot(50, "", colorDarkRed,styleDashed);
Plot(70, "", colorDarkRed);
numbars = LastValue(Cum(Status("barvisible")));
fraction= IIf(StrRight(Name(),3) == "",3.2,3.2);
hts = Param ("Text Shift", -50,-100,100,10);
PlotText(">>" + WriteVal(C,fraction),
SelectedValue(BarIndex()+1)-(numbars/hts),SelectedValue(r),colorWhite);
PlotText("Bot= " + WriteVal(30,fraction),
SelectedValue(BarIndex()+2)-(numbars/hts),SelectedValue(30),colorDarkRed);
PlotText("Top= " + WriteVal(70,fraction),
SelectedValue(BarIndex()+2)-(numbars/hts),SelectedValue(70),colorDarkRed);
_SECTION_END();


_SECTION_BEGIN("TD Fractl LINE");
strength = Param("Strength",1,1,15,1);
pR=PeakBars(RSI(14),strength)==0;
PlotShapes(shapeSmallCircle*pR,colorWhite,0,r,0);
_SECTION_END();

_SECTION_BEGIN("TD Fractl LINE");
pS =TroughBars(RSI(14),strength)==0;
PlotShapes(shapeSmallCircle*pS,colorYellow,0,r,0);
_SECTION_END();

_SECTION_BEGIN("Price Risistance");
RT=SelectedValue(ValueWhen(pR,r));
ST=SelectedValue(ValueWhen(pS,r));
Plot(RT,"",colorCustom7,styleThick);
Plot(ST,"",colorYellow,styleThick);
_SECTION_END();


_SECTION_BEGIN("RT,ST ");
{ GfxSelectFont("Arial",11, 700 );
GfxSetBkMode(1);
GfxSetTextColor(colorCustom12);
GfxTextOut("RT= "+WriteVal(H,format=1.2)+"",930,1);
GfxSetTextColor(colorYellow);
GfxTextOut("ST= "+WriteVal(L,format=1.2)+"",930,20);

}
_SECTION_END();


_SECTION_BEGIN("Buy/Sell Arrows");
shapesswitch = ParamToggle("Arrows","On,Off",1);
UPcolor = ParamColor( "UP Color", colorBlue );
DOWNcolor = ParamColor( "Down Color", colorRed );
Buy=Cross( RSI( periods), 30 );
Sell=Cross( 70, RSI( periods) );
shape = Buy * shapeSmallUpTriangle + Sell * shapeSmallDownTriangle;
PlotShapes( IIf(shapesswitch,-1e10,shape), IIf( Buy, UPcolor, DOWNcolor ));
_SECTION_END();

_SECTION_BEGIN("EMA Time Frame");
r= RSI(14);
pR=PeakBars(RSI(14),1)==0;
pivothigh = Ref(pR,-1)<pR AND pR>Ref(pR,1);
y0=SelectedValue(ValueWhen(pivothigh,RSI(14),2));
y1=SelectedValue(ValueWhen(pivothigh,RSI(14),1));
x0=SelectedValue(ValueWhen(pivothigh,Cum( 1)-1,2));
x1=SelectedValue(ValueWhen(pivothigh,Cum( 1)-1,1));
LineA=LineArray(x0,y0,x1,y1,1);
pS =TroughBars(RSI(14),1)==0;
pivotlow = Ref(pS,-1)<pS AND pS>Ref(pS,1);
yt0=SelectedValue(ValueWhen(pivotlow,RSI(14),2));
yt1=SelectedValue(ValueWhen(pivotlow,RSI(14),1));
xt0=SelectedValue(ValueWhen(pivotlow,Cum( 1)-1,2));
xt1=SelectedValue(ValueWhen(pivotlow,Cum( 1)-1,1));
LineB=LineArray(xt0,yt0,xt1,yt1,1);

_SECTION_BEGIN("DIV");
u00=LastValue(Peak(r,1,2));
u11=LastValue(Peak(r,1,1));
a00=BarCount - 1 - LastValue(PeakBars(r,1,2));
price_start1=Close[a00];
a11=BarCount - 1 - LastValue(PeakBars(r,1,1));
price_end1=Close[a11];
Line = LineArray(a00,u00,a11,u11, 0 );
LastPointSell = LineArray(a11-1,u11-1,a11,u11,0);

GG=u11<u00 AND price_end1>price_start1;
PlotShapes(shapeSmallCircle*GG ,colorCustom12,0,Line,5);

PlotShapes(shapeSmallDownTriangle*GG,colorRed,0,LastPointSell,-15);
_SECTION_END();

_SECTION_BEGIN("DIV");
u0=LastValue(Trough(r,1,2));
u1=LastValue(Trough(r,1,1));
a0=BarCount - 1 - LastValue(TroughBars(r,1,2));
price_start=Close[a0];
a1=BarCount - 1 - LastValue(TroughBars(r,1,1));
price_end=Close[a1];
Line = LineArray(a0,u0,a1,u1, 0 );

TT=u1>u0 AND price_end<price_start;
LastPointBuy = LineArray(a1-1,u1-1,a1,u1,0);
PlotShapes(shapeSmallCircle*TT,colorCustom11,0,Line,-5);
PlotShapes(shapeSmallUpTriangle*TT,colorCustom11,0,LastPointBuy,-15);
_SECTION_END();

r= RSI(14);
W1=ValueWhen(HHV(r,14),r,1);
strength = Param("Strength",5,2,15,1);
bi = Cum(1)-1;

function GetTop(bars)
{
Top =r== HHV(r,2*bars) AND Ref(HHV(r,bars),bars) < r;
Top = Top AND LastValue(bi)-ValueWhen(Top,bi) > bars;
return Top;
}

function GetValley(bars)
{
Valley = W1== LLV(W1,2*bars) AND Ref(LLV(W1,bars),bars) >W1;
Valley = Valley AND LastValue(bi)-ValueWhen(Valley,bi) > bars;
return Valley;
}
P1 = GetTop(strength);
V1 = GetValley(Strength);
RF=ValueWhen(P1,r);
SF=ValueWhen(V1,W1);
cbar = Param("cbar",4,2,50,1);
RF1 = IIf(RF AND BarsSince(P1) <=cbar,RF,Null);
SF1 = IIf(SF AND BarsSince(V1) <=cbar,SF,Null);
Plot(RF1,"",colorWhite,styleDots | styleNoLine);
Plot(SF1,"",colorWhite,styleDots | styleNoLine);
Plot(RF,"",colorOrange,40+16|styleNoLabel);
Plot(SF,"",colorOrange,40+16|styleNoLabel);
PlotShapes(IIf(P1, shapeSmallSquare,shapeNone),colorYellow,0,r,10);
PlotShapes(shapeSmallCircle*P1,colorBlack,0,r,10);
PlotShapes(IIf(V1, shapeSmallSquare,shapeNone),colorYellow,0,W1,-10);
PlotShapes(shapeSmallCircle*V1,colorBlack,0,W1,-10);
numbars = SelectedValue(Cum(Status("barvisible")));
fraction= IIf(StrRight(Name(),3) == "",3.2,3.2);
hts = Param ("Text Shift", -50,-100,100,10);
PlotText("" + WriteVal(RF,fraction),
SelectedValue(BarIndex()+10)-(numbars/hts),SelectedValue(RF),colorWhite,colorOrange);
PlotText("" + WriteVal(SF,fraction),
SelectedValue(BarIndex()+10)-(numbars/hts),SelectedValue(SF),colorWhite,colorOrange);


_SECTION_BEGIN("Unnamed 24");

Lbp=Param("lbp",50,1,500,5);
rp=Param("rp",14,5,100,1);
b30=(Sum(RSI(rp)<30,Lbp))*100/Lbp;
b30n50=(Sum(RSI(rp)>30 && RSI(rp)<50,Lbp))*100/Lbp;
b50n70=(Sum((RSI(rp)>50 && RSI(rp)<70),Lbp))*100/Lbp;
a70=(Sum(RSI(rp)>70,Lbp))*100/Lbp;
GfxSetBkColor(colorBlack);
GfxSetTextColor(colorYellow);
GfxTextOut(" bellow 30= "+b30+"%",5,20);
GfxTextOut(" above 30 & bellow 50= "+b30n50+"%",5,40);
GfxTextOut(" above 50 & bellow 70= "+b50n70+"%",5,60);
GfxTextOut(" above 70 = "+a70+"%",5,80);
GfxTextOut(" total="+(b30+b30n50+b50n70+a70)+"%",5,100);
_SECTION_BEGIN("RSI");
SetChartOptions(0,0,chartGrid30|chartGrid70);
periods = Param( "Periods", 14, 1, 200, 1 );
Plot( vrsi = RSI( periods), _DEFAULT_NAME(),colorCustom12,styleNoLine| styleNoLabel  );
if( Status("action") == actionCommentary )
SetChartOptions(0,chartShowArrows|chartShowDates);
priceTitle=StrFormat(" {{NAME}} {{VALUES}}");

if( ParamToggle("Tooltip shows", "All Values|Only Prices" ) )
{
ToolTip=StrFormat("Open: %g\nHigh: %g\nLow: %g\nClose: %g (%.1f%%)\nVolume: "+NumToStr( V, 1 ), O, H, L, C, SelectedValue( ROC( C, 1 )));
}
Sign up here with your email
ConversionConversion EmoticonEmoticon