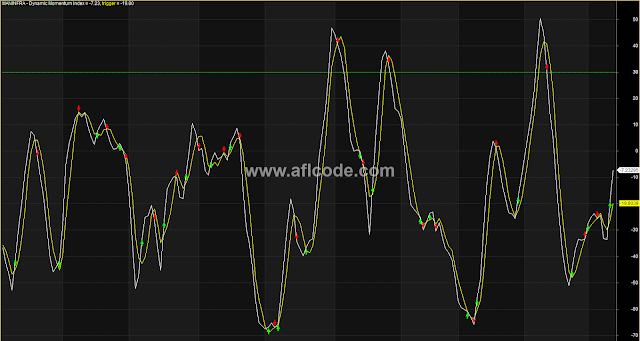
 |
| Dynamic Momentum Index |
//www.aflcode.com
CMO5_1=Sum( IIf( C > Ref( C, -1 ) , ( C - Ref( C ,-1 ) ) ,0 ) ,5 ) ;
CMO5_2=Sum( IIf( C < Ref( C ,-1 ) , ( Ref( C ,-1 ) - C )  ,0 ) ,5 );
CMO5=DEMA(100 * Nz(( CMO5_1 -CMO5_2)  /( CMO5_1+CMO5_2)),3);

//Cmo10 formula
CMO10_1=Sum( IIf( C > Ref( C, -1 ) , ( C - Ref( C ,-1 ) ) ,0 ) ,10 ) ;
CMO10_2=Sum( IIf( C < Ref( C ,-1 ) , ( Ref( C ,-1 ) - C )  ,0 ) ,10 );
CMO10=DEMA(100 * Nz(( CMO10_1 -CMO10_2)  /( CMO10_1+CMO10_2)),3);

//Cmo20 formula
CMO20_1=Sum( IIf( C > Ref( C, -1 ) , ( C - Ref( C ,-1 ) ) ,0 ) ,20 ) ;
CMO20_2=Sum( IIf( C < Ref( C ,-1 ) , ( Ref( C ,-1 ) - C )  ,0 ) ,20 );
CMO20=DEMA(100 * Nz(( CMO20_1 -CMO20_2)  /( CMO20_1+CMO20_2)),3);

// dmi formula
dmi=((StDev(C,5)* CMO5)+(StDev(C,10)* CMO10)+(StDev(C,20)*
CMO20))/(StDev(C,5)+StDev(C,10)+StDev(C,20));
pds=Param("Smoothing",3,1,10,1);
pds1=Param("Trigger Line",5,1,10,1);

Plot(EMA(dmi,pds),"Dynamic Momentum Index",colorWhite,1);
Plot(MA(dmi,pds1),"trigger",colorYellow,1);

Buy=Cross(EMA(dmi,pds),MA(dmi,pds1));
Sell=Cross(MA(dmi,pds1),EMA(dmi,pds));
PlotShapes(IIf(Buy,shapeUpArrow,shapeNone) ,colorBrightGreen);
PlotShapes(IIf(Sell,shapeDownArrow,shapeNone),colorRed);
PlotGrid(70,colorRed);
PlotGrid(30,colorBrightGreen);
Sign up here with your email
ConversionConversion EmoticonEmoticon