 |
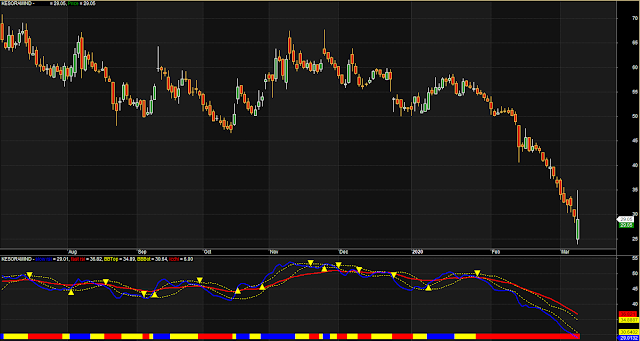
| EMI RSI Buy Sell Arrow |
//www.aflcode.com
_SECTION_BEGIN("plot ema of rsi");


r = Param("rsi", Optimize("RSI",39,1,39,1),1,39,1);
slow_per = Param( "smaller period",Optimize("smaller period",3,1,39,1),1,39,1);
fast_per = Param( "bigger", Optimize("bigger",27,1,50,1),1,50,1);

f = EMA(RSI(r),slow_per);


Plot (EMA(RSI(r),slow_per),"slow rsi",colorBlue,styleThick);
Plot (EMA(RSI(r),fast_per),"fast rsi",colorRed,styleThick);


_SECTION_END();
bbtop = BBandTop( f, 10, 0.8 );
bbbot = BBandBot( f, 10, 0.8 );
Buy = Cross (f,bbtop);
Short= Cross (bbbot,f);
//Short = Cross (EMA(RSI(r),fast_per),EMA(RSI(r),slow_per));
//Cover =  f > Ref(f,-2);

PlotShapes(Buy*shapeUpTriangle,colorYellow);
PlotShapes(Short*shapeDownTriangle,colorYellow);
//PlotShapes(Sell*shapeHollowSmallCircle,colorRed);
//PlotShapes(Cover*shapeHollowSmallCircle,colorGreen);


_SECTION_BEGIN("Bollinger Bands");
Plot( BBandTop( f, 10, 0.8 ), "BBTop" , colorYellow, styleDashed );
Plot( BBandBot( f, 10, 0.8 ), "BBBot" , colorYellow, styleDashed );

Color_buy = IIf (f > BBtop, colorBlue,IIf(f < BBbot,colorRed,colorYellow));
Plot(6,"icchi",Color_buy,styleOwnScale| styleArea|styleNoLabel,-0.5,100);

_SECTION_END();
Sign up here with your email
ConversionConversion EmoticonEmoticon