 |
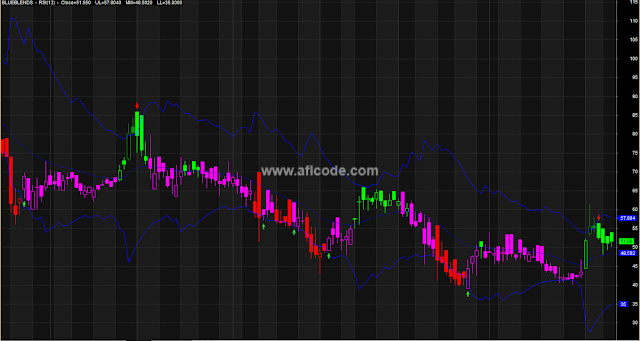
| RSI-based-Envelope-Style-Trading-Indicator |
//www.aflcode.com
// RSI Levels - appplied to Price Chart shows how far
// tomorrow's closing price has to move in order for
// the RSI to cross the 70, 50 & 30 levels.

pd = Param("Periods",13,5,144,1);
pds = 2*pd-1;//     (Adjustment for Wilders MA)
aa = Close-Ref(Close,-1);
uu = EMA(Max(0,aa),pds);
dd=  EMA((Max(0,0-aa)),pds);

rf = IIf(C>2,1000,10000);

c1 = Param("Upper Level",70,50,90,1);
qq1 =100/(100-c1)-1;
ff1 = qq1*dd-uu;
ff2 = ff1/qq1;
f1 = Max(ff1,ff2);
UL = Close + f1*(pds-1)/2;
UL = IIf(UL>C,floor(UL*rf),ceil(UL*rf))/rf;

c2 = Param("Equilibrium",50,50,50,0);
qq2 =100/(100-c2)-1;// [=1]
ff = dd-uu;
MM = Close + ff*(pds-1)/2;
MM = IIf(MM>C,floor(MM*rf),ceil(MM*rf))/rf;

c3 = Param("Lower Level",30,10,50,1);
qq3 =100/(100-c3)-1;
ff1 = qq3*dd-uu;
ff2 = ff1/qq3;
f3 = Min(ff1,ff2);
LL = Close + f3*(pds-1)/2;
LL = IIf(LL>C,floor(LL*rf),ceil(LL*rf))/rf;

Plot(UL,"",29,1);
Plot(MM,"",29,32);
Plot(LL,"",29,1);

Cbr = IIf(UL<C,27,IIf(LL>C,32,IIf(MM>C,11,8)));
PlotOHLC(O,H,L,C,"",cbr,styleCandle);

X=Cross( C,LL);
Y=Cross(UL,C);

Buy= X ;
Sell= Y ;

PlotShapes(shapeUpArrow*Buy,colorLime,0,L,-15);
PlotShapes(shapeDownArrow*Sell,colorRed,0,H,-15);

Filter=Buy OR Sell ;
AddTextColumn(FullName(),"Name");
AddColumn(Buy,"Buy");
AddColumn(Sell,"sell");


Title = Name() + "  -  RSI(" + WriteVal(pd,0.0) + ")  -  Close=" +  WriteVal(Close,0.3) + "    UL=" +  WriteVal(UL,0.4) + "    MM=" +  WriteVal(MM,0.4) + "    LL=" +  WriteVal(LL,0.4);
Sign up here with your email
ConversionConversion EmoticonEmoticon