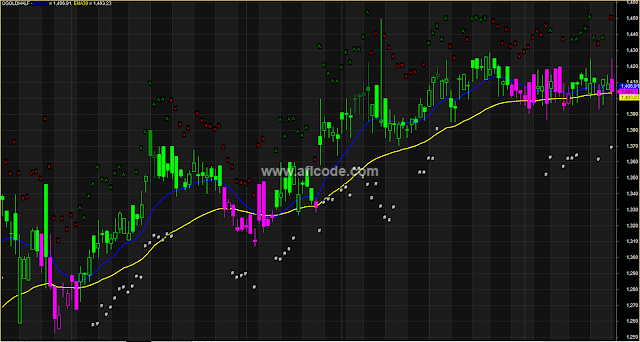
 |
| RSI-Levels-Crossover-Trading-System |
//www.aflcode.com
_SECTION_BEGIN("Indicator price rsi  levels");
// RSI Levels - appplied to Price Chart shows how far
// tomorrow's closing price has to move in order for
// the RSI to cross the 70, 50 & 30 levels.
SetChartBkColor( colorBlack ) ;
pd = Param("Periods",13,5,144,1);
pds = 2*pd-1;//     (Adjustment for Wilders MA)
aa = Close-Ref(Close,-1);
uu = EMA(Max(0,aa),pds);
dd=  EMA((Max(0,0-aa)),pds);

rf = IIf(C>2,1000,10000);

c1 = Param("Upper Level",70,50,90,1);
qq1 =100/(100-c1)-1;
ff1 = qq1*dd-uu;
ff2 = ff1/qq1;
f1 = Max(ff1,ff2);
UL = Close + f1*(pds-1)/2;
UL = IIf(UL>C,floor(UL*rf),ceil(UL*rf))/rf;

c2 = Param("Equilibrium",50,50,50,0);
qq2 =100/(100-c2)-1;// [=1]
ff = dd-uu;
MM = Close + ff*(pds-1)/2;
MM = IIf(MM>C,floor(MM*rf),ceil(MM*rf))/rf;

c3 = Param("Lower Level",30,10,50,1);
qq3 =100/(100-c3)-1;
ff1 = qq3*dd-uu;
ff2 = ff1/qq3;
f3 = Min(ff1,ff2);
LL = Close + f3*(pds-1)/2;
LL = IIf(LL>C,floor(LL*rf),ceil(LL*rf))/rf;

//Plot(UL,"",29,1);
//Plot(MM,"",29,32);
//Plot(LL,"",29,1);

Cbr = IIf(UL<C,27,IIf(LL>C,32,IIf(MM>C,11,8)));
PlotOHLC(O,H,L,C,"",cbr,styleCandle);

X=Cross( C,LL);
Y=Cross(UL,C);
//Buy = x;
//Sell = y;
Buy = Trix( 9 ) > Ref( Trix( 9 ) , -1 )
AND MACD( 13, 39 ) > Ref( MACD( 13, 39 ) , -1 );
//AND ADX( 9 ) > Ref( ADX( 9 ) , -1 );

Sell =  Trix( 9 ) < Ref( Trix( 9 ) , -1 )
AND MACD( 13, 39 ) < Ref( MACD( 13, 39 ) , -1 );
//AND ADX( 9 ) > Ref( ADX( 9 ) , -1 );
dist = 1.5*ATR(10);
dist1 = 2*ATR(10);
trend = ADX( 9 ) > Ref( ADX( 9 ) , -1 );


//PlotShapes(Trend*styleDots,colorPink);
//PlotShapes(Sell*shapeSmallDownTriangle,colorRed);
for( i = 0; i < BarCount; i++ )
{
if( Buy[i] ) PlotText( "A", i, H[ i ]+dist[i], colorGreen, colorBlack );
if( Sell[i] ) PlotText( "v" , i, H[ i ]+dist[i], colorRed, colorBlack );
if( trend[i] ) PlotText( "#", i, L[ i ]-dist1[i], colorWhite, colorBlack );

//if( Sell[i] ) PlotText( "Sell\n@" + C[ i ], i, H[ i ]+dist[i], colorBlack, colorRed );


}


//Filter=Buy OR Sell ;
//AddTextColumn(FullName(),"Name");
//AddColumn(Buy,"Buy");
//AddColumn(Sell,"sell");


//Title = Name() + "  -  RSI(" + WriteVal(pd,0.0) + ")  -  Close=" +  WriteVal(Close,0.3) + "    UL=" +  WriteVal(UL,0.4) + "    MM=" +  WriteVal(MM,0.4) + "    LL=" +  WriteVal(LL,0.4);
//P = ParamField("Price field",-1);
//Periods = Param("Periods", 39, 2, 300, 1, 10 );
//Plot( MA( Close,3),"MA3",colorRed,  styleThick =4);
Plot( EMA( Close,13),"EMA13",colorBlue,styleThick =4  );
Plot( EMA( Close,39),"EMA39",colorYellow,styleThick =4  );
//Plot( EMA( Close,50),"EMA50",colorBlack  );
//Plot( MA( Close,1),"MA3",colorYellow);
//IIf( EXPRESSION, TRUE_PART, FALSE_PART )

//iff (EMA( Close, 39 ) > Ref( EMA( Close, 39 ), -1 ) AND EMA (Close,3)>EMA(Close,39),) ;

trend_up = EMA( Close, 39 ) > Ref( EMA( Close, 39 ), -1 ) AND EMA (Close,3)>EMA(Close,39);
trend_down = EMA( Close, 39 ) < Ref( EMA( Close, 39 ), -1 ) AND EMA (Close,3)<EMA(Close,39);
WriteIf( trend_up, "\n  EMA-39 up by"+ WriteVal(EMA( Close, 39 ) - Ref( EMA( Close, 39 ), -1 )),"");
WriteIf( trend_down, "\n  EMA-39 DOWN by"+ WriteVal(Ref( EMA( Close, 39 ), -1 )-EMA( Close, 39 )),"");
_SECTION_END();
Sign up here with your email
ConversionConversion EmoticonEmoticon