 |
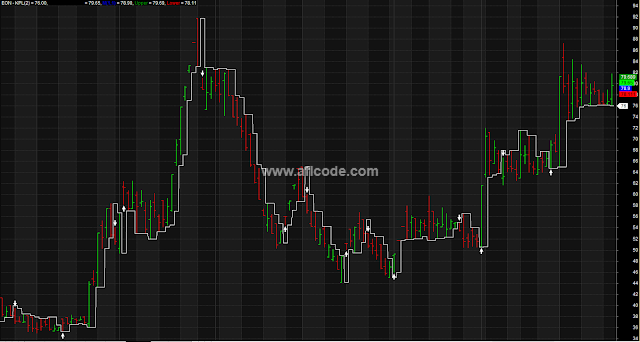
| Accurate Bar Chart Perfect Buy Sell Arrows |
//www.aflcode.com
_SECTION_BEGIN("KPL");

no=Param( "Swing", 2, 1, 55 );
tsl_col=colorWhite;

res=HHV(H,no);
sup=LLV(L,no);
avd=IIf(C>Ref(res,-1),1,IIf(C<Ref(sup,-1),-1,0));
avn=ValueWhen(avd!=0,avd,1);
tsl=IIf(avn==1,sup,res);

Plot(tsl, _DEFAULT_NAME(), tsl_col, styleStaircase, styleThick, 0,0,1);

Buy=Cross(C,tsl);
Sell=Cross(tsl,C);
shape=Buy*shapeUpArrow + Sell*shapeDownArrow;
PlotShapes(shape,IIf(Buy,tsl_col,tsl_col),0,IIf(Buy,Low,High));
_SECTION_END();
_SECTION_BEGIN("ANCHORED VWAP CHANNEL");
dn = DateTime();
sd = SelectedValue( dn );

start = dn == sd;

mp = (H+L)/2;

PV = mp * V;
CV = Cum( V );
VSS = CV - ValueWhen( start, CV );

denom = IIf( VSS == 0, 1, VSS );
num = Cum( PV ) - ValueWhen( start, Cum( PV ) );

M = IIf( BarsSince( start ), num/denom, mp );

Q1 = Param("Percentage Upper", 1, 0, 10, 0.01 );
Q2 = Param("Percentage Lower", 1, 0, 10, 0.01 );

Plot( C, Date() + " Close", colorBlack, styleBar );
Plot( M, "M" + _PARAM_VALUES(), colorBlue );
Plot( M * ( 1 + Q1 * 0.01 ), "Upper", colorGreen );
Plot( M * ( 1 - Q2 * 0.01 ), "Lower", colorRed );
_SECTION_END();
Sign up here with your email
ConversionConversion EmoticonEmoticon