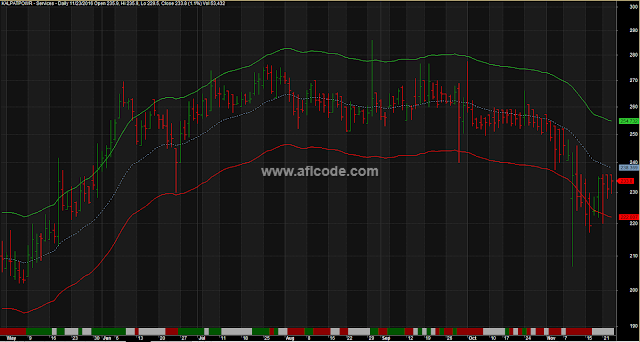
 |
| Auto Envelope Trading system |
//www.aflcode.com
_SECTION_BEGIN( "Price" );
Color = IIf(C > O, colorGreen, colorRed);
SetChartOptions( 0, chartShowDates | chartShowArrows | chartLogarithmic | chartWrapTitle );
_N( Title = StrFormat( "{{NAME}} - " + SectorID( 1 ) + " - {{INTERVAL}} {{DATE}} Open %g, Hi %g, Lo %g, Close %g (%.1f%%) Vol " + WriteVal( V, 1.0 ) + " {{VALUES}}", O, H, L, C, SelectedValue( ROC( C, 1 ) ) ) );
Plot( C, "Close", color, styleBar | styleNoTitle | ParamStyle( "Style" ) | GetPriceStyle() );

if ( ParamToggle( "Tooltip shows", "All Values|Only Prices" ) )
{
    ToolTip = StrFormat( "Open: %g\nHigh:  %g\nLow:   %g\nClose:  %g (%.1f%%)\nVolume: " + NumToStr( V, 1 ), O, H, L, C, SelectedValue( ROC( C, 1 ) ) );
}
_SECTION_END();

_SECTION_BEGIN( "Elder - AutoEnvelope" );
EMAP = Param("Base EMA",22,1,100,1);
Factor = Param("Factor",27,1,50,1);
Age = EMA(C,EMAP);
csize = StDev(2*Max(abs(H-Age) ,abs(L-Age)) / Age,100)*Factor/10;
//{Use 100 days for stable channel size - default is 2.7 std}
Csize1 = ValueWhen(DayOfWeek()<Ref(DayOfWeek() ,-1) OR (DayOfWeek()==Ref(DayOfWeek(),-1) AND Day() != Ref(Day(),-1)),Ref(csize,-1),1);
//{ This pegs the StDev to last bar of week  AND only changes once per week}
csize2 = LastValue(csize1);
//{fix to constant using last value}
channel=csize2*Age;
Plot(Age+channel/2, "", colorLime);
Plot(Age-channel/2, "", colorRed);
Plot(age, "", colorLightBlue, styleDashed);
_SECTION_END();

_SECTION_BEGIN( "Elder - Impulse" );
macShort = Param("MACD Short MA",12,1,100,1);
macLong = Param("MACD Long MA",26,1,100,1);
macSmooth = Param("MACD Smoothing Period",9,1,100,1);
EMAP = Param("Short EMA",13,1,40,1);
macTime = Param("Time Ratio",1,22,1);
macShort = macShort*macTime;
macLong = macLong*macTime;
macSmooth = macSmooth*macTime;
ExpMA = EMAp*MacTime;


//{ do long impulse next }
mac = EMA(C,macShort)-EMA(C,macLong);
MacSig = EMA(mac,macSmooth);
macplot = (mac-MacSig);
impulse = IIf(macplot >= Ref(macplot,-macTime), 1,0)+IIf(Close > EMA(Close,ExpMA),1,0)-1;
gr = IIf(impulse>0,1,0);  //{ Buy OK}
rd = IIf(impulse<0,1,0);  //{ Sell OK}
gre = IIf(impulse=0,1,0); //{ Either OK }
//PlotGrid(0, "", colorLightGrey);  //{ Zero Line }

Plot( 1, "", IIf(gr, colorDarkGreen, IIf(rd, colorDarkRed, IIf(gre, colorDarkGrey,0))), styleOwnScale|styleArea|styleNoLabel, -0.1, 50 );
_SECTION_END();

GraphXSpace = 5;
Sign up here with your email
ConversionConversion EmoticonEmoticon