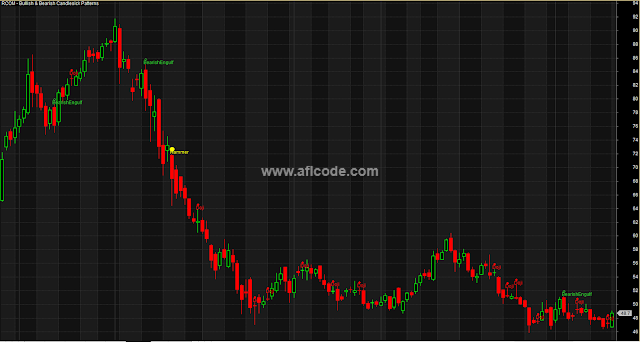
 |
| Candlestick Chart Pattern Detector |
//www.aflcode.com
Plot(C,"",colorLightGrey,styleCandle);

r=CdDoji( threshold = 0.05 );
s=CdHammer( rangefactor= 1.1 );
t=CdBearishEngulfing( bodyfactor = 0.4, rangefactor = 0.5);
u=CdBullishEngulfing( bodyfactor = 0.4, rangefactor = 0.5);
PlotShapes(r*shapeSmallCircle,colorRed,Layer=0,yposition=H,Offset=12);
PlotShapes(s*shapeCircle,colorYellow,Layer=0,yposition=H,Offset=12);
PlotShapes(t*shapeHollowSmallCircle,colorLime,Layer=0,yposition=H,Offset=12);
PlotShapes(u*shapeHollowCircle,colorBlue,Layer=0,yposition=H,Offset=12);

for(i=0;i<BarCount-1;i++)
{
 if(r[i]==True)PlotText("Doji", i, H[i], colorRed, bkcolor = colorDefault);
 if(s[i]==True)PlotText("Hammer", i, H[i], colorYellow, bkcolor = colorDefault);
 if(t[i]==True)PlotText("BearishEngulf", i, H[i], colorLime, bkcolor = colorDefault);
 if(u[i]==True)PlotText("BullishEngulf", i, H[i], colorBlue, bkcolor = colorDefault);
}
Sign up here with your email
ConversionConversion EmoticonEmoticon