 |
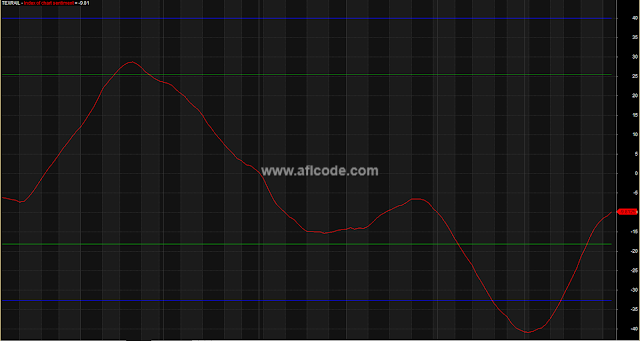
| Chart Index Sentiment Indicator |
//www.aflcode.com
Body = abs( Open - Close );
Lshd = IIf( Close >= Open, Open - Low, Close-Low );
Ushd = IIf( Close >= Open, High - Close, High - Open );
ThBotB =BBandBot( Body,55,0.5);
ThTopB =BBandTop( Body,55,0.5);
ThBotL =BBandBot( Lshd,55,0.5);
ThTopL =BBandTop( Lshd,55,0.5);
ThBotU =BBandBot( Ushd,55,0.5);
ThTopU =BBandTop( Ushd,55,0.5);
CandleWeight =
( Close == Open ) * IIf( Ushd >= Lshd, 64, -64)
+
( Close != Open ) * IIf( Close > Open, 1, -1 ) *
(
IIf( body <= ThBotB, 80, 0 ) +
IIf( body > ThBotB AND body <= ThTopB, 96, 0 ) +
IIf( body > ThTopB, 112, 0 )
)
+
IIf( Close >= Open, -4, 4 ) *
(
IIf( lshd = 0, 3, 0 ) +
IIf( lshd < ThBotL AND lshd > 0, 2,0 ) +
IIf( lshd > ThBotL AND lshd <= ThTopL AND lshd > 0, 1, 0 )
)
+
IIf( Close >= Open, 1, -1 ) *
(
IIf( ushd > 0 AND ushd <= ThBotU, 4, 0 ) +
IIf( ushd > ThBotU AND ushd <= ThTopU , 8, 0 ) +
IIf( ushd > ThTopU, 12, 0 )
);
ICS = MA( MA( CandleWeight, 24 ), 24 );
Plot( ICS, "Index of chart sentiment", colorRed );
ChannelWidth = LastValue( StdErr( ICS, BarCount/2 ));
Center= LastValue(Highest(ICS)+Lowest(ICS))/2;
Plot( Center + 2.5 *ChannelWidth, "", colorBlue, styleNoLabel );
Plot( Center - 2.5 *ChannelWidth, "", colorBlue , styleNoLabel);
Plot( Center + 1.5*ChannelWidth, "", colorGreen, styleNoLabel );
Plot( Center - 1.5 * ChannelWidth, "", colorGreen, styleNoLabel );
GraphXSpace=2;
Sign up here with your email
ConversionConversion EmoticonEmoticon