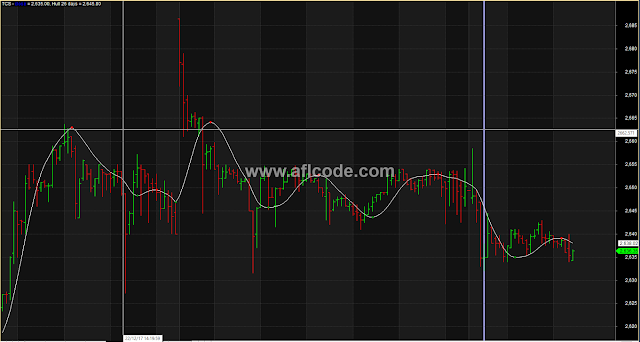
How to use Hull Moving Average Bar Chart Amibroker afl?
Hull Moving Average Bar Chart is one of the popular Amibroker afl. The hull moving average is simply applied on bar chart. Hull Moving Average Bar Chart afl can be used to determine the current trend. If price is above HMA, indicates bullish trend. If price goes down of HMA, one can think of selling. Hull Moving Average Bar Chart afl can be used in any time frame.
 |
| Hull Moving Average Bar Chart |
//www.aflcode.com
SetChartBkColor(16);

Period = Param("Period",26,1,100,1);
Hull = WMA( 2*WMA(C,int(Period/2))- WMA(C,Period),int(sqrt(Period)));

Plot(C,"close",6,128);

for( i = 1 ; i < BarCount-2; i++ )
{
if (hull[i] <hull[i-1] && hull[i] <hull[i+1])
 Lpml[i]=1;
else
Lpml[i] =0;

if (hull[i] >hull[i-1] && hull[i] >hull[i+1])
 Lpmh[i]=1;
else
Lpmh[i] =0;
}

GR =ExRem(LpmH,Lpmh);
RD =ExRem(Lpml,Lpml);

PlotShapes(IIf(GR!=0,shapeSmallCircle,shapeNone),colorRed,0,hull,0);
PlotShapes(IIf(RD!=0,shapeSmallCircle,shapeNone),colorGreen,0,hull,0);
Plot(Hull,"Hull "+Period+" days",2,1);
Sign up here with your email
ConversionConversion EmoticonEmoticon